Network Trace - How to get Wireshark network trace and network trace from 2N® StarGate / 2N® BlueTower?
Network trace contains whole communication between IP devices over LAN. In order to analyse what this communication between devices contains, a network trace can be requested.
If network trace is requested, please note there are two possible network traces available. Gateway can provide network tracing with limited size on its side, for unlimited network trace of IP communication, external device (usually laptop or PC) equipped with network capture software needs to be used. This article explains how to perform both network trace in such software called Wireshark as well as network trace directly from gateway.
How to get Wireshark network trace?
How to get network trace from 2N® StarGate / 2N® BlueTower?
How to get Wireshark network trace?
Program Wireshark is used for tracing the communication between devices interconnected by LAN. The devices (e.g. PBX connected with a GSM gateway via LAN) send to each other packets which are captured by the above mentioned program. Wireshark is distributed under the Open source licence (http://www.wireshark.org/download.html).
Before starting network capture
Before Wireshark (or in general, any packet capture tool) is used, careful consideration should be given to where in the network packets are to be captured.
In order to capture all the packets which are sent via particular LAN, the devices have to be part of the same network segment (they have to be connected via HUB). If you do not have a hub you can use a switch which supports so called port mirroring (http://en.wikipedia.org/wiki/Port_mirroring).
Download Wireshark
Obtain a Wireshark package or installer for the operating system running on the system which is to be used for packet capture.
Download a binary or installer from http://www.wireshark.org. With installers, ensure all product components are selected for installation.
Start Wireshark
On a Linux or Unix environment, select the Wireshark or Ethereal entry in the desktop environment's menu, or run "wireshark" (or "ethereal") from a root shell in a terminal emulator.
In a Microsoft Windows environment, launch wireshark.exe from program installation folder.
Note that on Unix systems, a non-GUI version of Wireshark called "tshark" (or "tethereal") may be available as well, but its use is beyond the scope of this article.
Use Wireshark (capture network communication)
After starting Wireshark, do the following:
- Select Capture | Interfaces
- Select the interface on which packets need to be captured.
- Now click the Start button to start the capture.
- Recreate the issue. The capture dialog should show the number of packets increasing. If packets are not being captured, try removing any filters that have been defined.
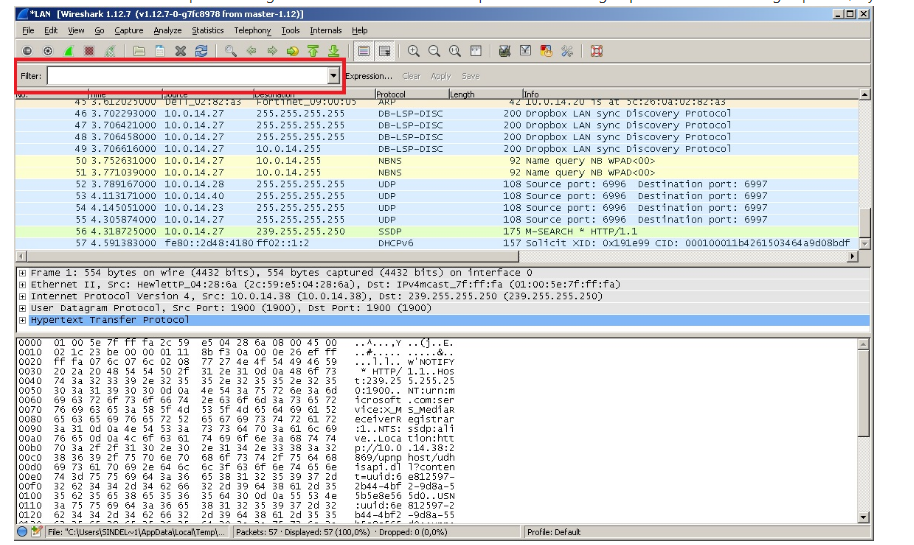
Important: In order to provide us with detailed information about the possible problem with the device, please do not apply any filter and simply capture all the communication during the test (call/smpp/email2sms,etc...). - Once the issue which is to be analysed has been reproduced, click on Stop. It might take a few seconds for Wireshark to display the packets captured.
- Save the packet trace in following format: „File->Save As->Wireshark/tcpdump/… -libpcap(*.pcap;*.cap) .
Just click on the File menu option and select Save As.
By default Wireshark will save the packet trace in libpcap format. This is a filename with a.pcap extension.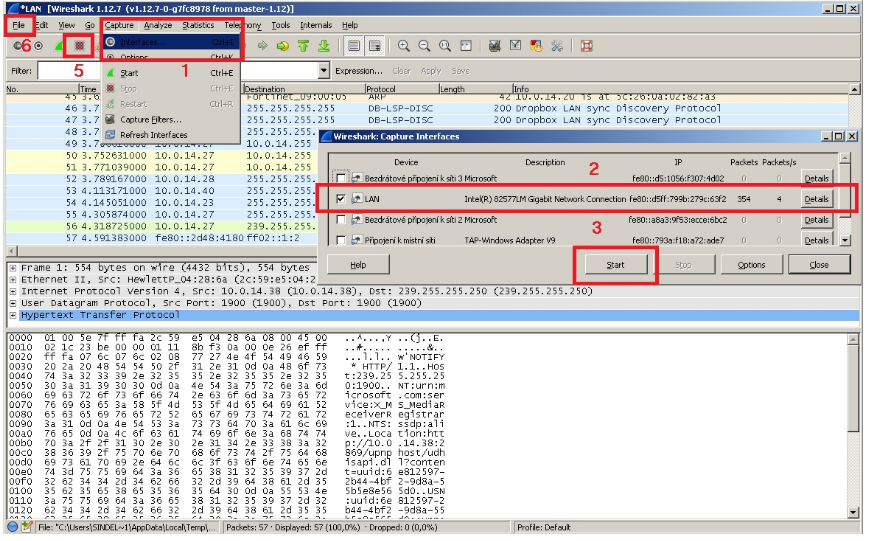
- Please send saved file to us for analysis.
How to get network trace from 2N® StarGate / 2N® BlueTower?
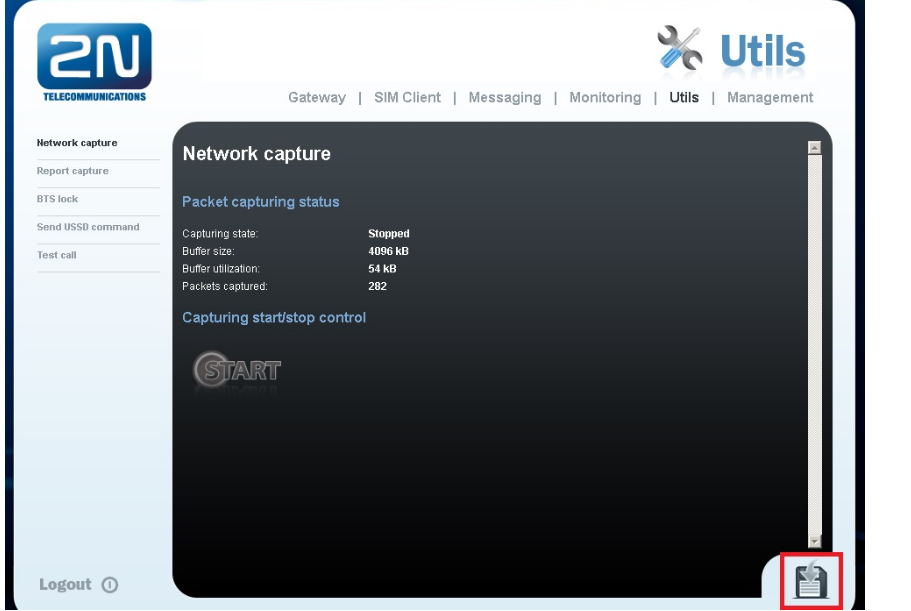
- Network trace from gateway can be run via menu Utils -> Network capture. The web interface can store up to 4096kB long trace.
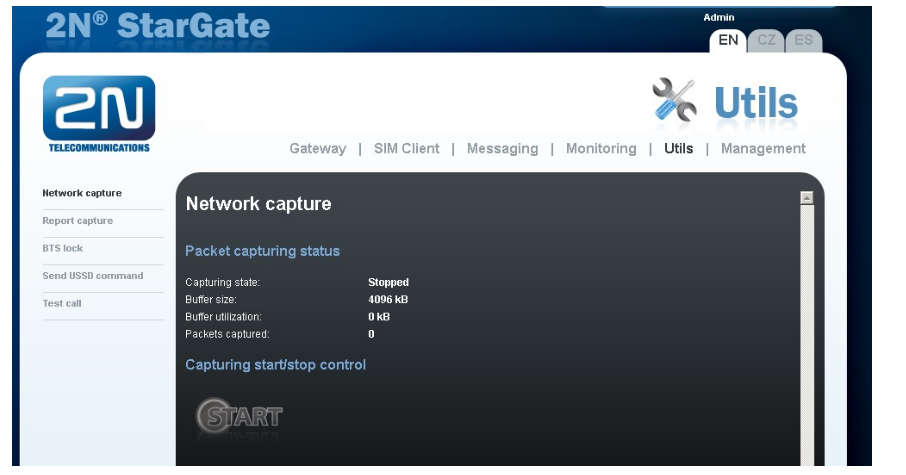
- Network trace can be started by clicking on button START. You will be notified by message "Running..." in capturing status. The Buffer utilisation and Packets captured should show the number of packets increasing. If not, then restart the capture. If Buffer utilisation is on value 4096kB (same as Buffer size), please restart the trace and tests from beginning.
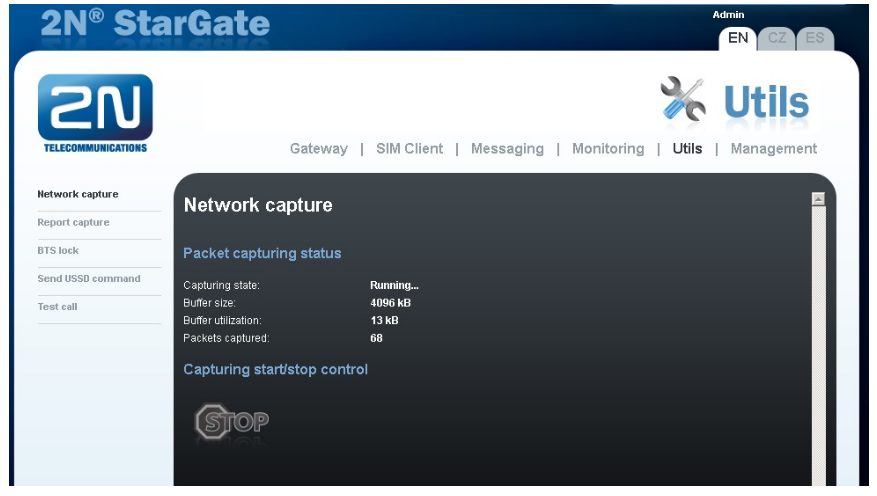
- Recreate the issue.
- Once the issue which is to be analysed has been reproduced, click on Stop. Once trace is stopped, you can save it to your computer by clicking on the diskette icon located in bottom right corner of web interface
- Please send saved file to us for analysis.