How to report a technical problem with 2N® IP Handset device (firmware, reset, backup, trace, logs)
This FAQ describes what to do in case of technical problems with the 2N® IP Handset.
1) Firmware
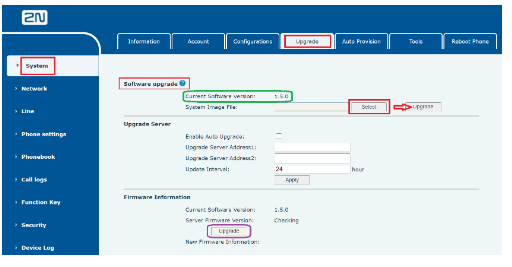
- always have the current firmware version on the device - you can perform the update in the web interface in the System section and the Upgrade tab (see the picture below)
a) by clicking on the Select button we select the file with the given version from the local storage and then perform the upgrade by clicking on the Upgrade button
b) by clicking on the Upgrade button in the Firmware Information section we can update the device online (if a new software version is detected)
- see the purple box in the picture below
- the device will restart automatically after the update file has been successfully uploaded
- in the "Upgrade" tab we can also see the current firmware version - see the green box on the image below
2) Configuration initialisation
- we reset the device to factory values ("factory reset") and try to set the required functions again - more here:
Factory reset - How to reset the settings of 2N® IP Handset to the factory values
3) Configuration backup
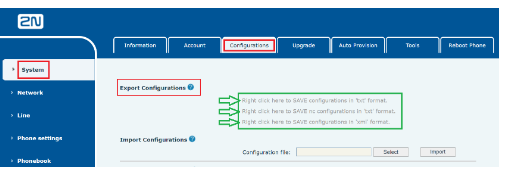
send us the downloaded configuration from the device - in the web interface go to the System section and to the Configurations tab and in the Export Configurations section we see three options how to back up the configuration (see picture below)
- so right-click on the third, last, line (in the green box in the image below) and download the configuration file in XML format
4) Network trace
- in the web interface go to the System section, the Tools tab and the Web Capture section and click the Start button (see the image below and the green box) - the file will start to be downloaded - do not interrupt the process
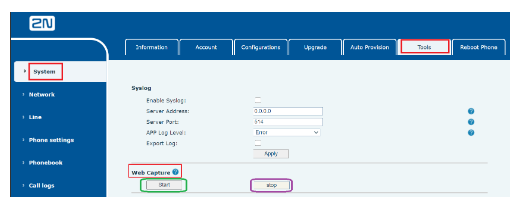
start a problematic action using network communication (typically a call or registration to the PBX / proxy server) and after its termination or the affected error, click the stop button
(see the purple box in the picture above), which ends the download and the desired PCAP file is automatically saved locally
5) System logs
- can only be saved externally
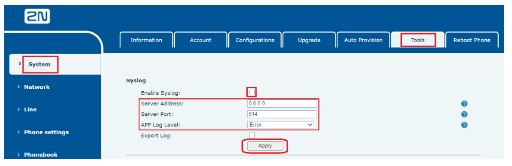
- in the web interface of the device go to the System section, to the Tools tab and the first paragraph is Syslog, where you check Enable Syslog
then fill in the server address where the logs will be uploaded, the port (default is 514) and the APP Log Level, or message level,
which will be logged (Debug / Information / Warning / Error), when the Debug level records everything, on the other hand Error at least ("only" errors)we will start the upload by clicking on the Apply button - see the picture below:
Tip
As the Syslog server enter the IP address of your PC, where you install and run e.g. the Syslog Watcher program,
and after clicking on Start the logs will start to load automatically and you can then export them directly to a file.